Exploring Conservation Data
Every year, dozens of field biologists employed by Bird Conservancy of the Rockies and our partners spend their spring counting birds for the Integrated Monitoring in Bird Conservation Regions (IMBCR) program. These technicians travel hundreds of miles across the western U.S., spending each morning surveying at randomly selected sites spanning both private and public land.
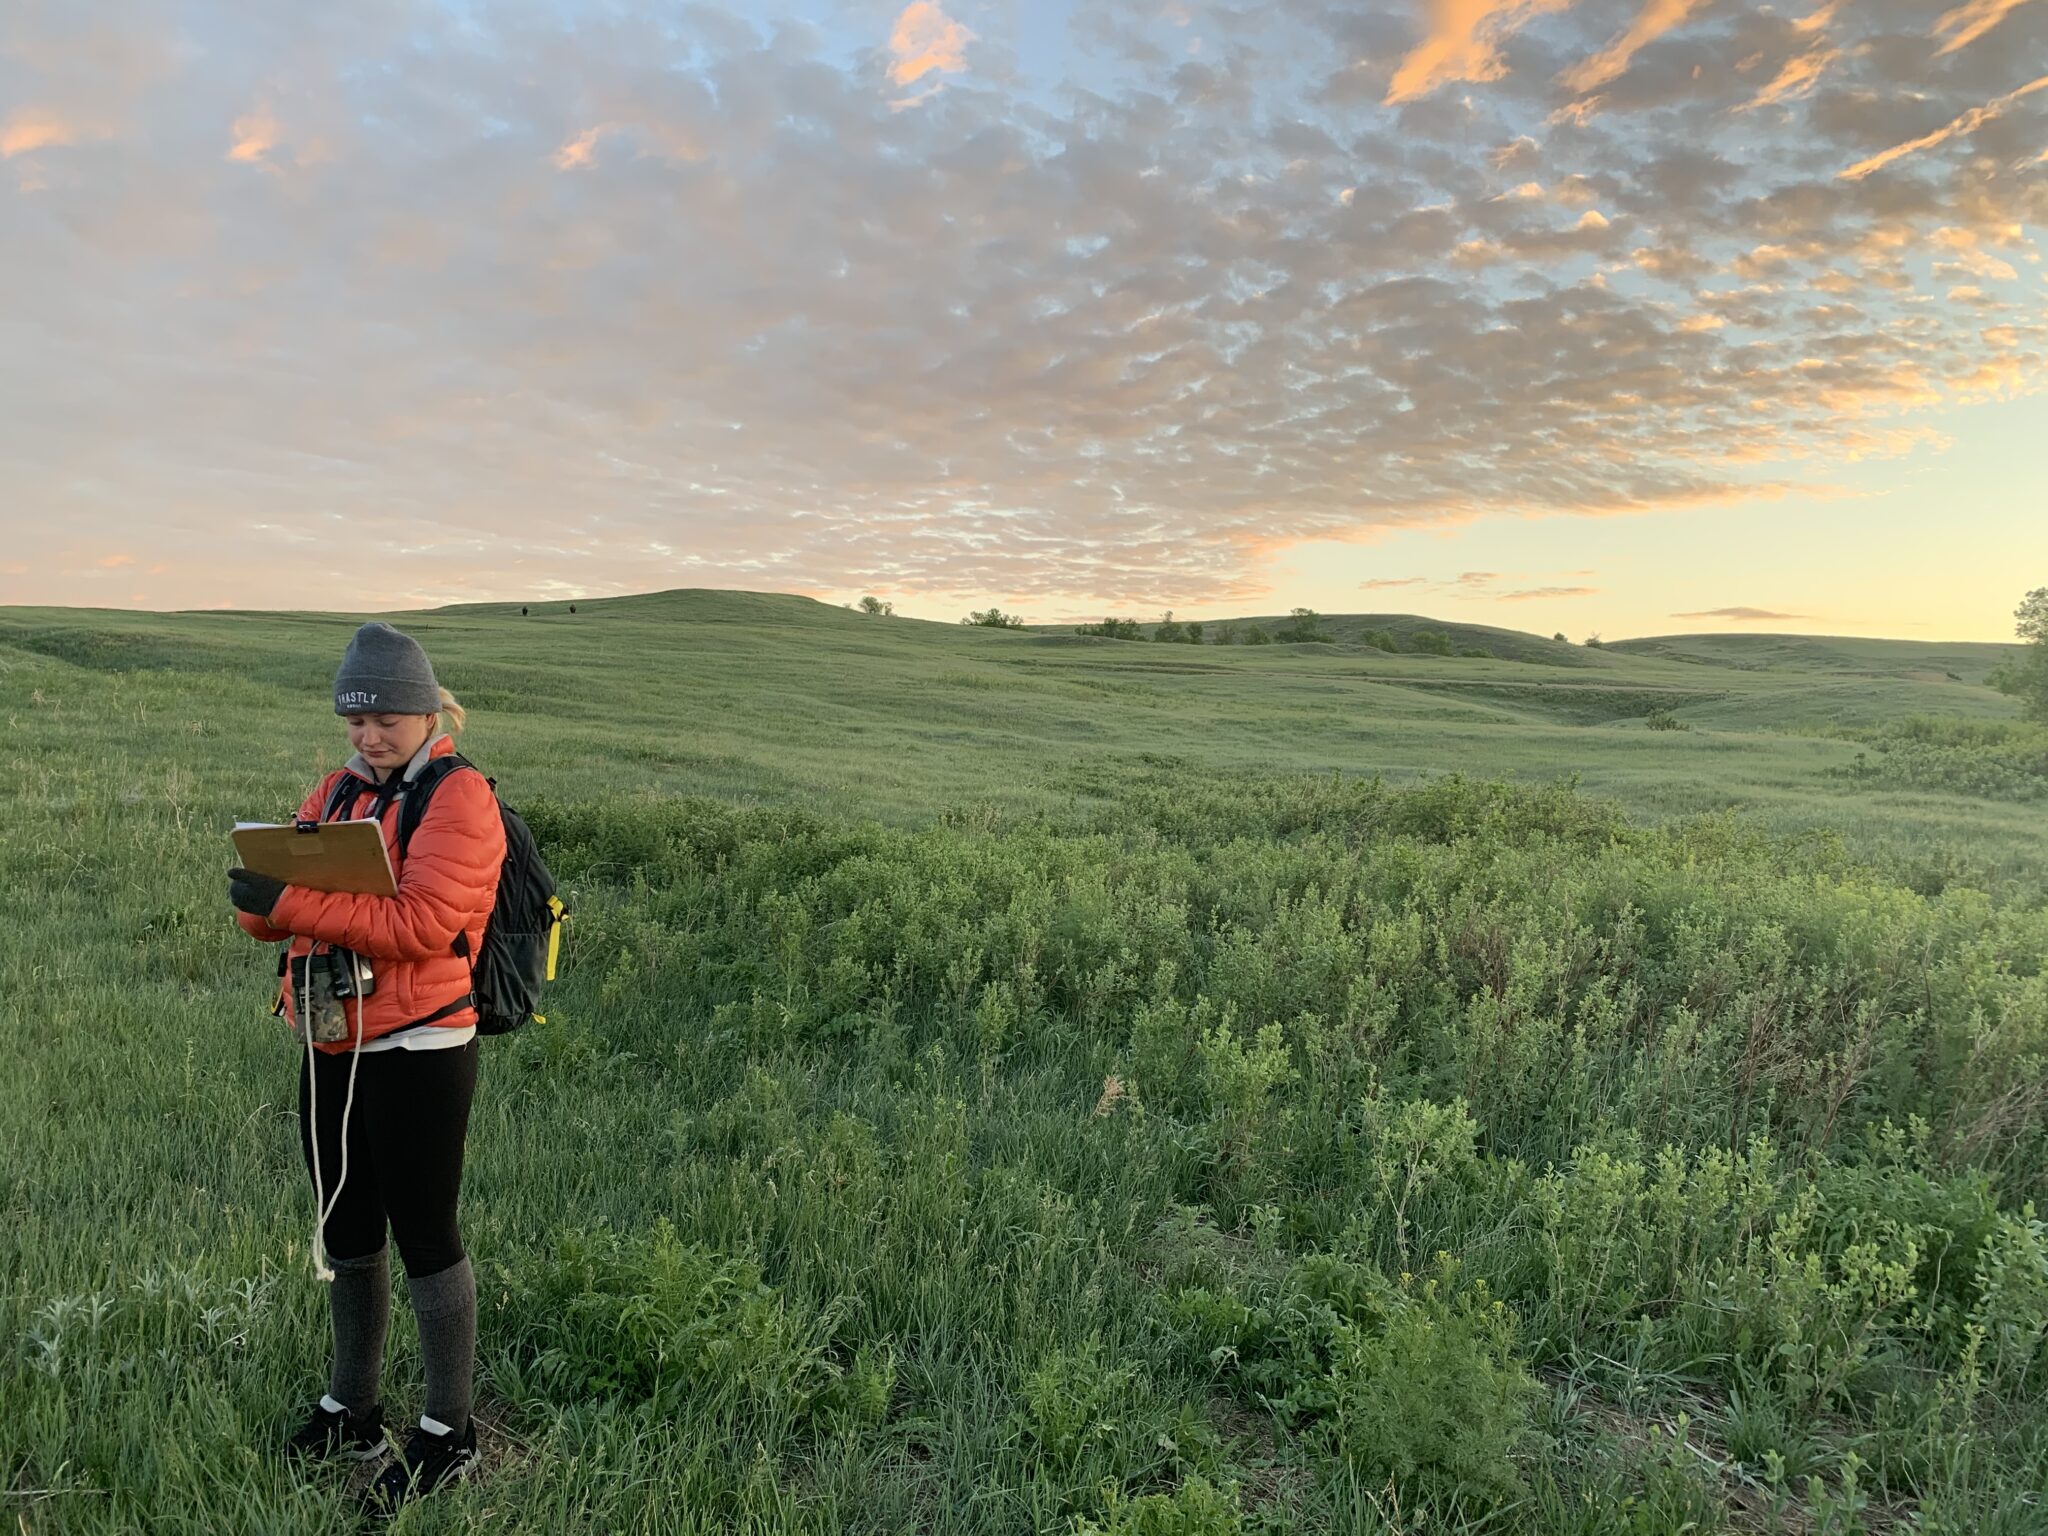
A technician with Integrated Monitoring in Bird Conservation Regions counts birds at dawn. Photo by Dave Sandahl.
Meanwhile, a cadre of land managers and researchers are behind computer screens using the data to understand bird population dynamics and make management decisions. IMBCR data allows them to address conservation concerns, such as determining the impact of disturbance or restoration, or selecting focal management species.
Keep reading for a brief overview of IMBCR’S unique study design, to explore two of IMBCR’s core data products, and to find out how you can use this freely-available data.
A design for quality data and informative comparisons
IMBCR allows multiple land managers to monitor birds at randomly-selected locations with the same methodology. Whether we survey in a National Forest, National Park, or on private land, we use the same protocol to count birds.
This allows us to make statistically valid comparisons across different land management units, which we refer to as strata (singular stratum). In the map below, each colored polygon represents a different stratum within Bird Conservation Region (BCR) 17 – Badlands and Prairies.
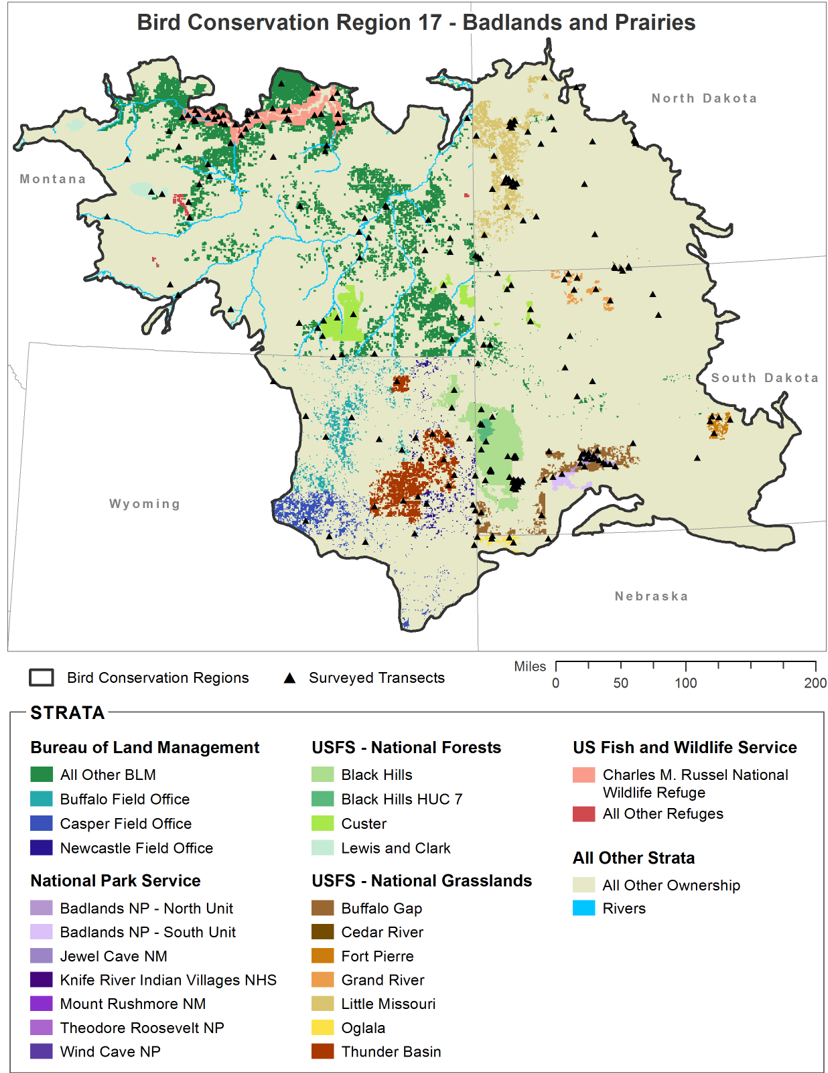
Map of land management units (strata) surveyed by Integrated Monitoring in Bird Conservation Regions in 2017 within the Badlands and Prairies Bird Conservation Region.
Data collected at each individual survey (black triangles) are used to calculate bird population metrics for the stratum in which they’re located (colorful polygons). Then, estimates from each stratum can be “rolled up” to provide estimates for broader geographic scales.
For example, surveys conducted on Thunder Basin National Grassland also contribute to bird population estimates for the state of Wyoming and Bird Conservation Region 17.
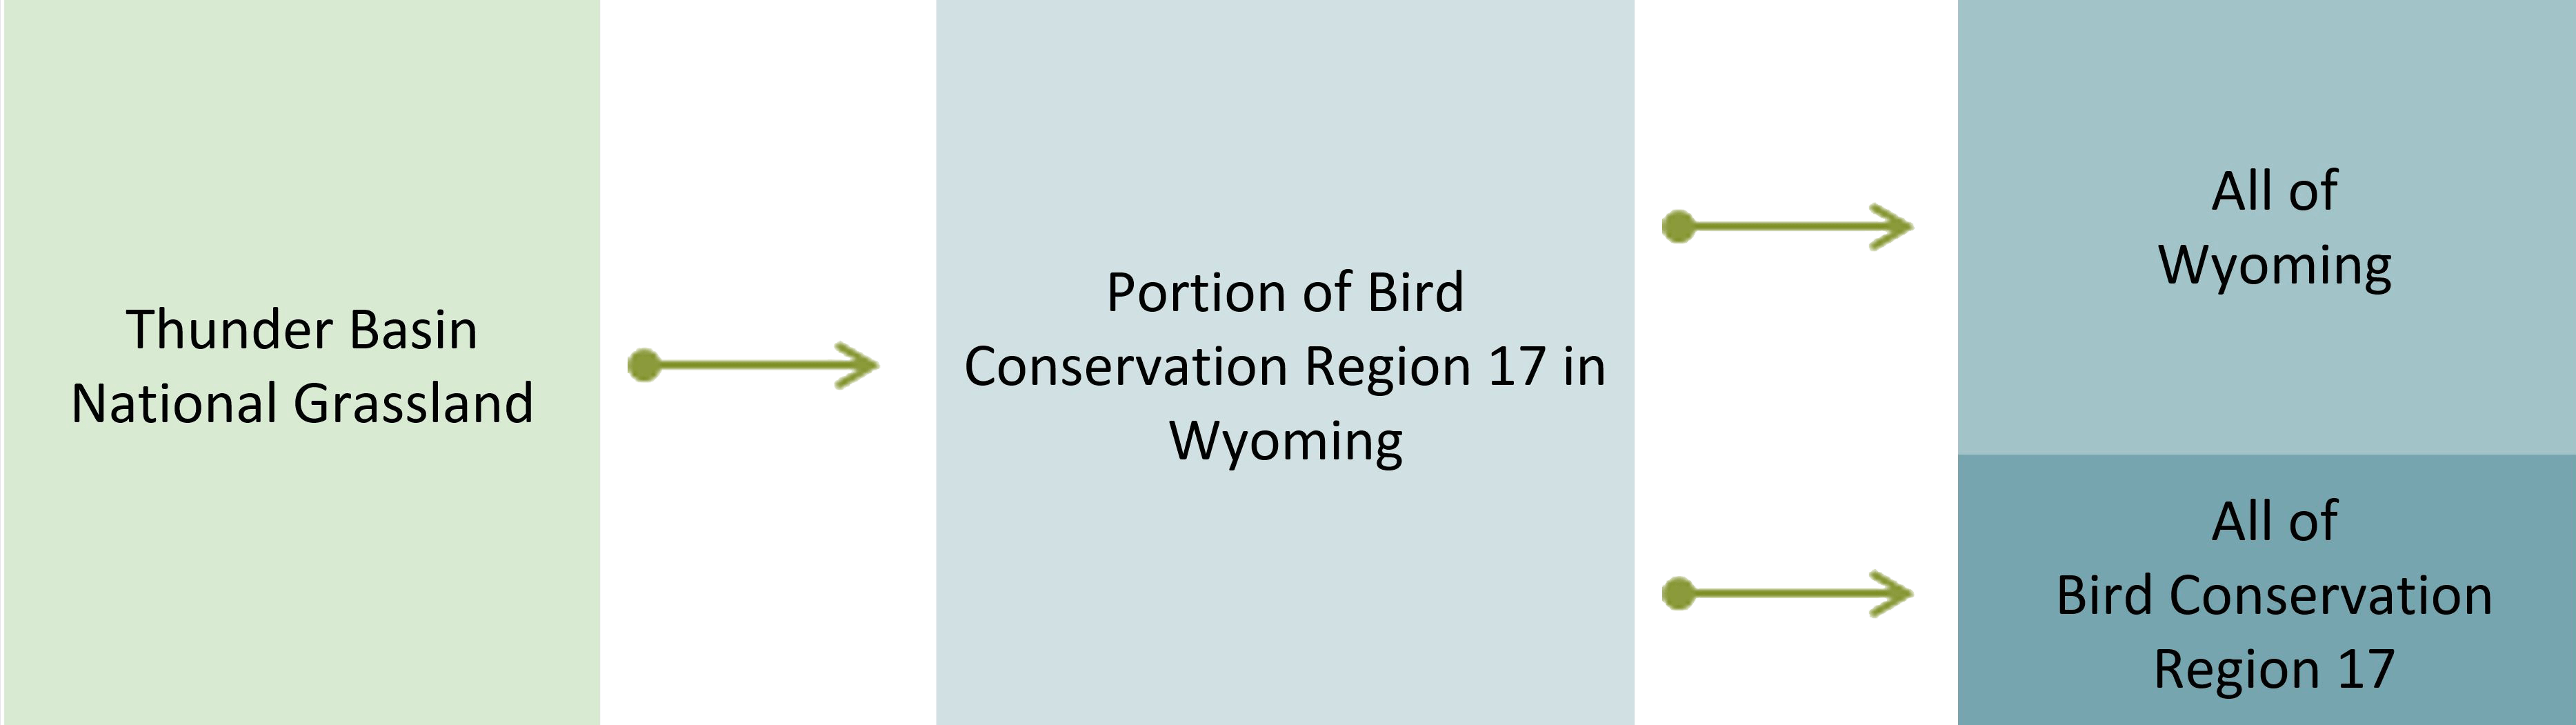
This allows land managers to understand how bird populations are doing locally compared to the larger region. We can identify where populations are increasing or decreasing, and find out where population strongholds occur. We can also use the data to understand how birds are affected by management action or habitat loss.
Measuring population trends
For each strata within IMBCR’s nested sampling design, we calculate several metrics for every species we detect. Let’s start by examining population trend, which is simply the change in population size over time.
In the graph below, population trends for 81 species in Bird Conservation Region 17 are shown with a black dot. Trend estimates greater than 1 indicate the species is increasing in population size, while trends less than 1 indicate a species is declining. Estimates right around 1 indicate the population size is stable.
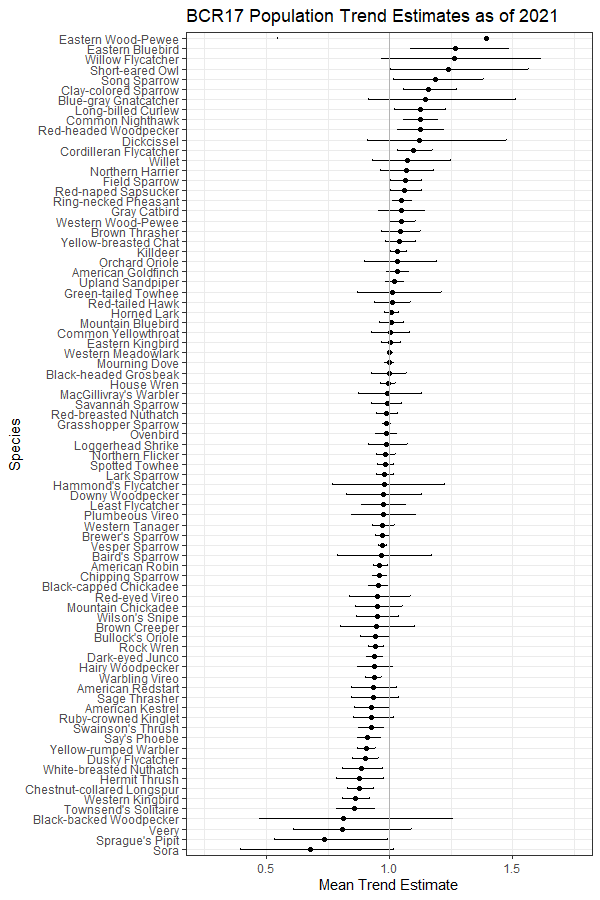
Estimates of population trend for 81 species within Bird Conservation Region 17 as of 2021. Error bars represent the 95% credible interval. Estimates are presented for species with at least five years of data and robust estimates for both density and trend (e.g., coefficient of variation < 50). Estimates > 1 indicate an increasing population, while estimates < 1 indicate a decreasing population.
Population trend data can be especially useful for state wildlife agencies, who revise the list of Species of Greatest Conservation Need for their State Wildlife Action Plans every 10 years. For example, Colorado Parks and Wildlife has used IMBCR population trend data to identify and monitor species included in their plan.
Exploring trend and density
In many states where we collect IMBCR data, grassland birds are a conservation priority due to ongoing population declines. Fortunately, IMBCR is well suited for monitoring grassland birds.
Below are population trend estimates for four grassland birds of conservation concern within BCR 17. We can see that Lark Bunting populations are holding steady, while Baird’s Sparrow, Chestnut-collared Longspur, and Sprague’s Pipit are all in decline in the region.
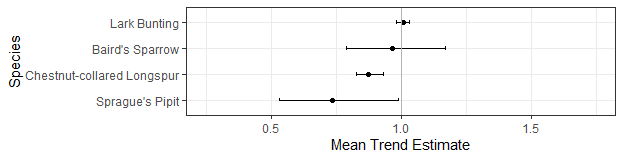
Estimates of population trend for four species within Bird Conservation Region 17 as of 2021. Error bars represent the 95% credible interval. Estimates > 1 indicate an increasing population, while estimates < 1 indicate a decreasing population.
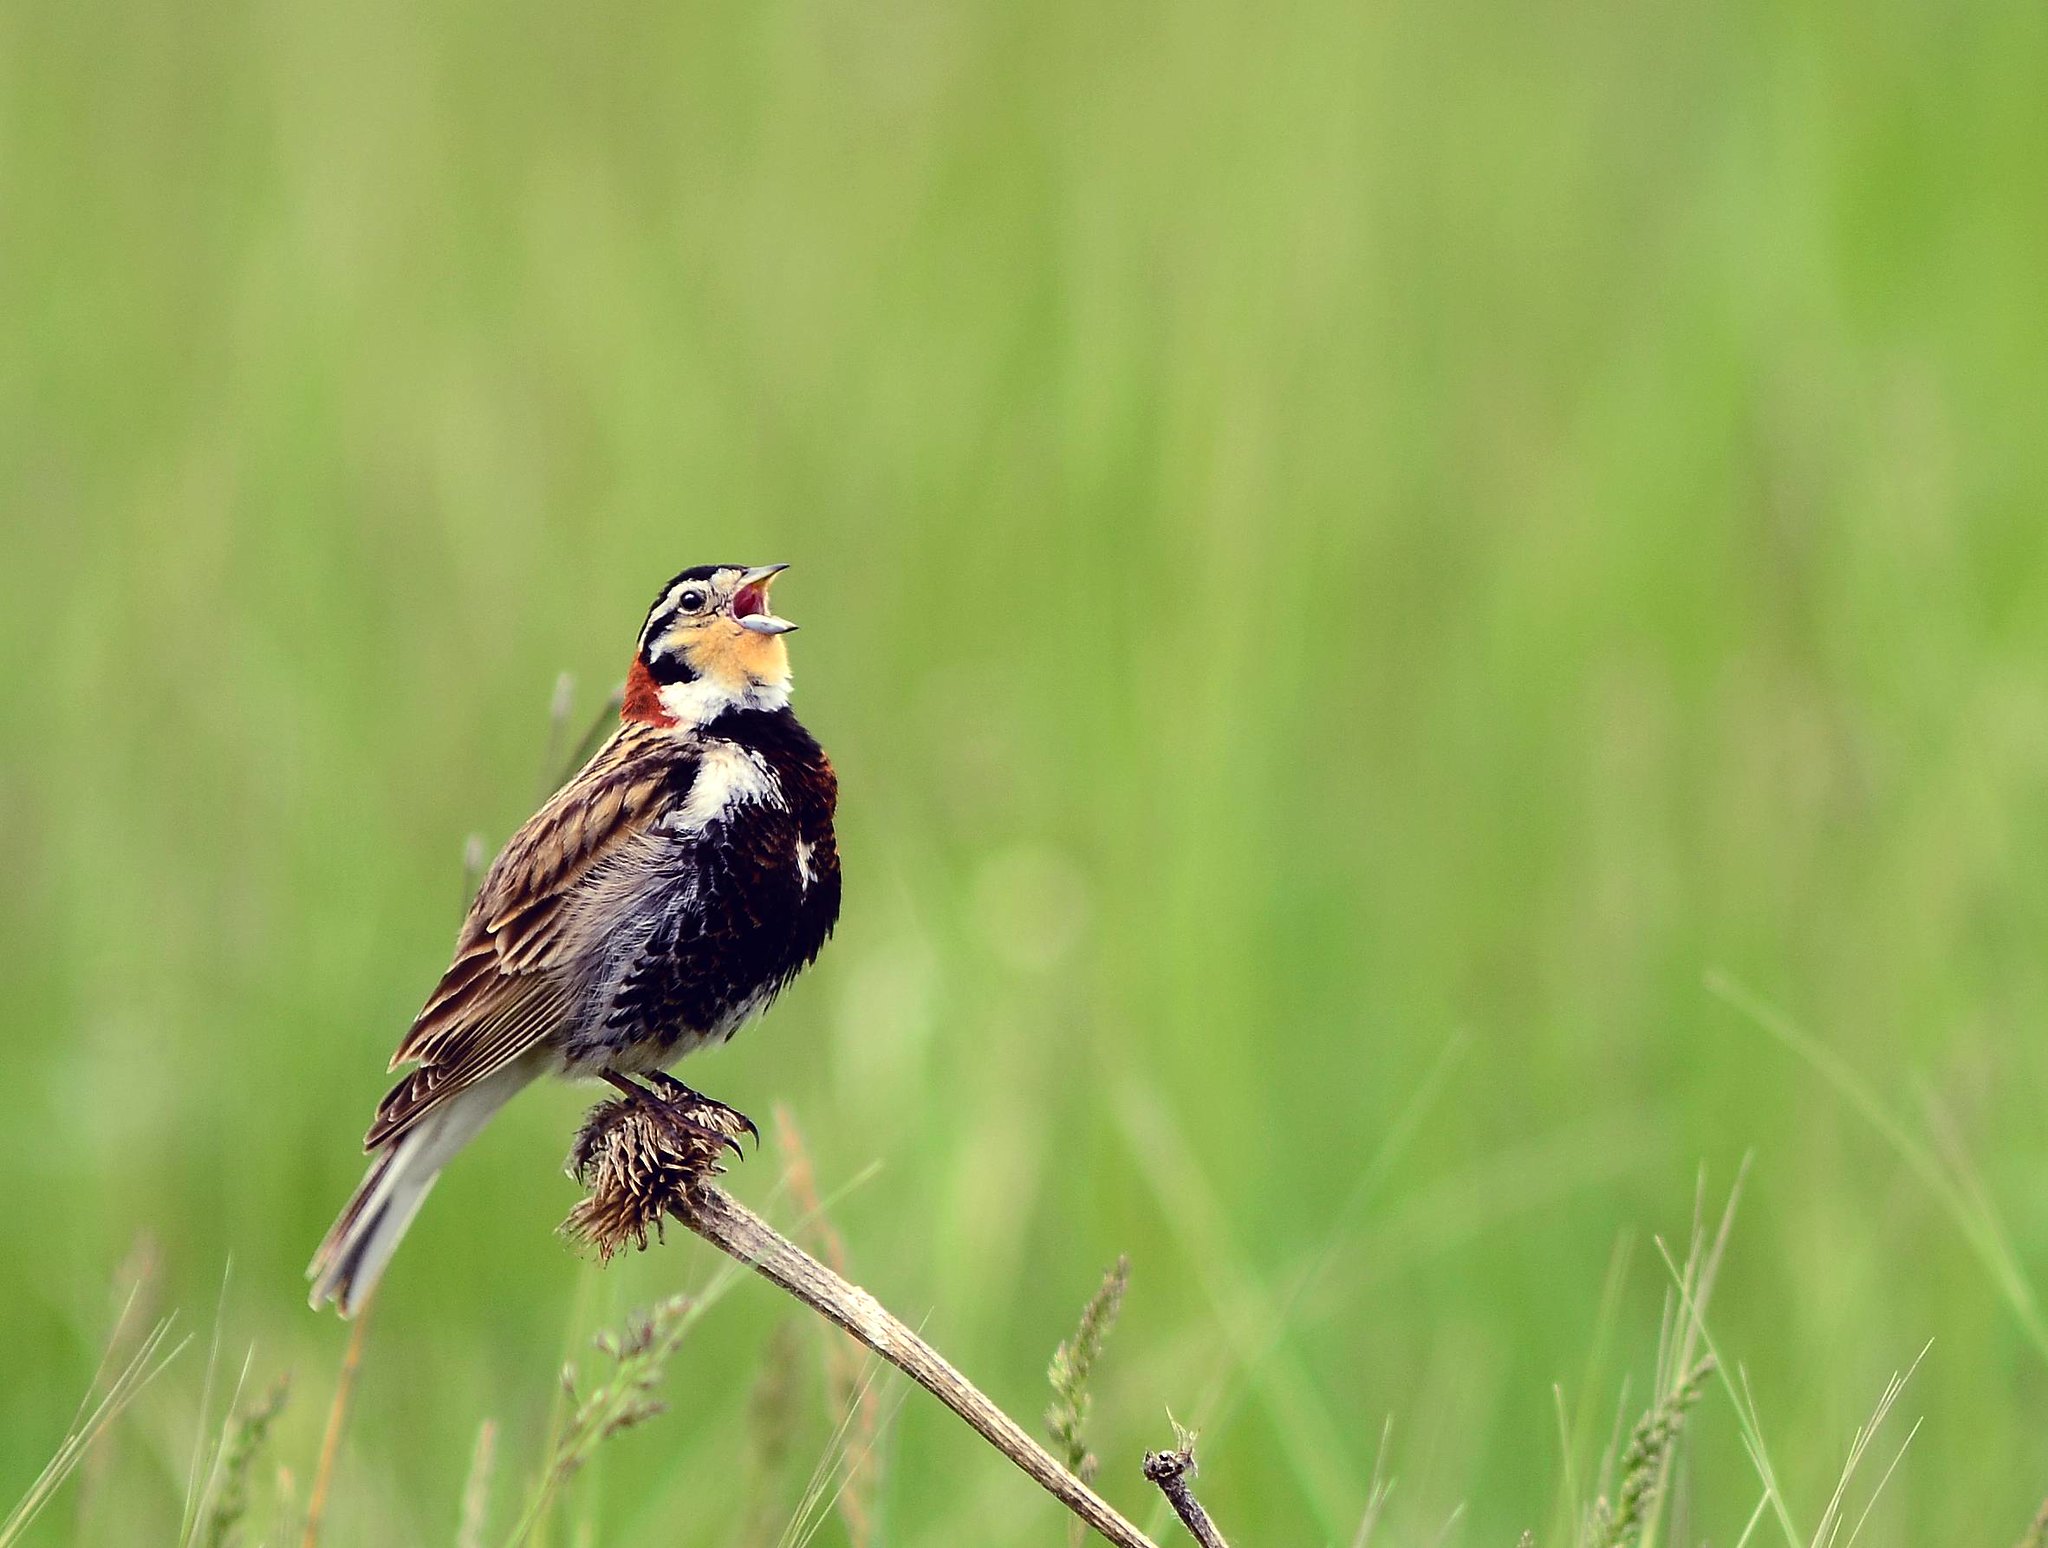
Chestnut-collared Longspur by Rick Bohn USFWS Mountain-Prairie (CC BY 2.0)
The population trend estimates are calculated from each species’ density – that is, the number of individuals per square kilometer. In the following plot, we can compare the change in density over time for Chestnut-collared Longspur and Lark Bunting within BCR17. For Chestnut-collared Longspur, densities have decreased nearly every year since 2009, while densities for Lark Buntings tend to fluctuate.
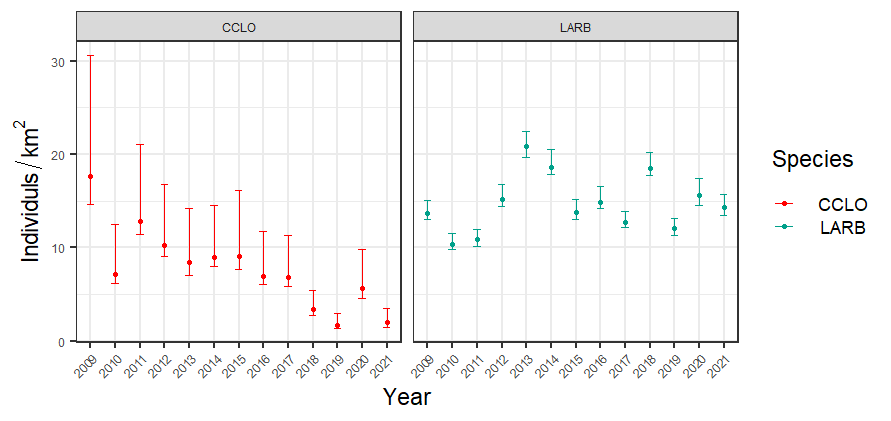
Density estimates for Chestnut-collared Longspur and Lark Bunting within Bird Conservation Region 17. Error bars represent the 95% credible interval.
Let’s take a closer look at how Lark Bunting densities change from year to year within each state that makes up BCR17. In the graph below, we can see the spatial variation in how density rises and falls in each strata.
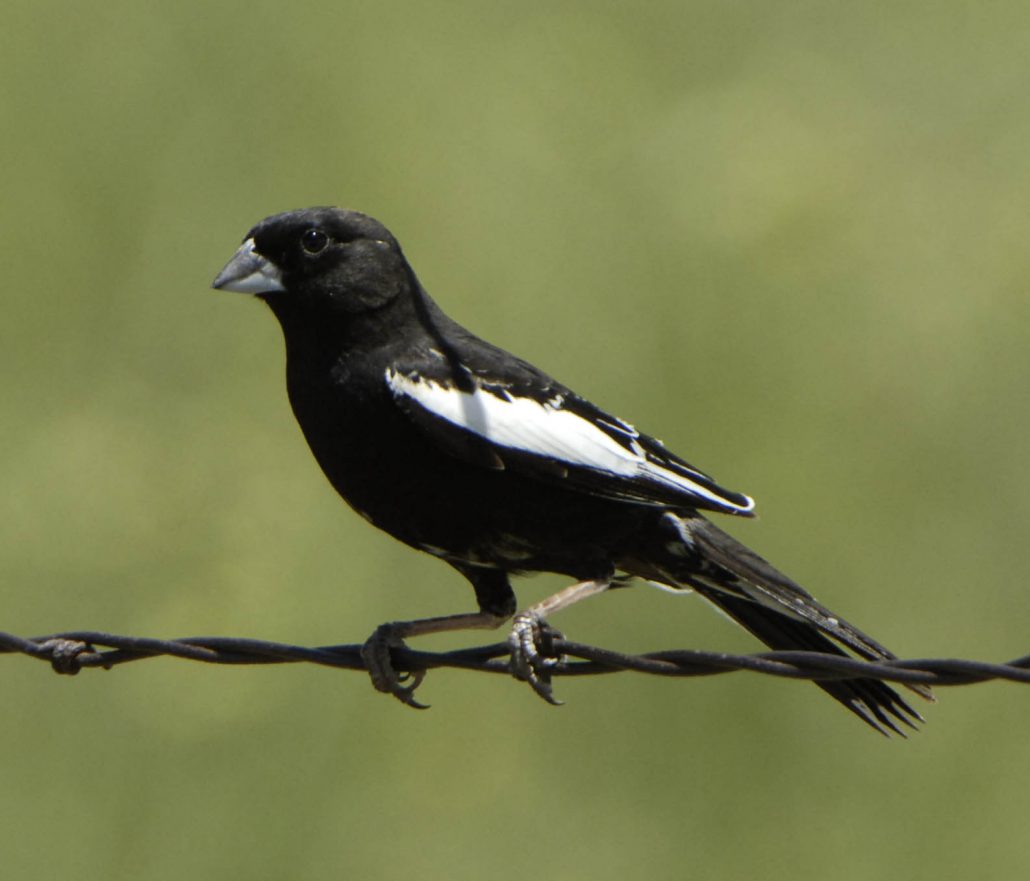
Male Lark Bunting by Bill Schmoker
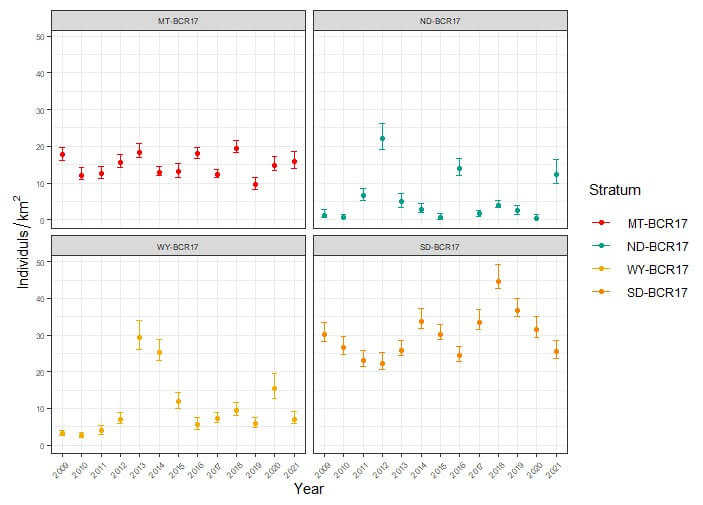
Density estimates for Lark Bunting within the portion of Bird Conservation Region 17 in Montana, North Dakota, South Dakota, and Wyoming,. Error bars represent the 95% credible interval.
Trend and density estimates are two of IMBCR’s “off the shelf” data products that are produced every year and are freely available for anyone to download and use from the Rocky Mountain Avian Data Center. Additionally, measures of abundance (size of population), occupancy (proportion of survey sites where the species was detected), and species lists are also available.
![]()
If you have questions about how IMBCR data might answer your conservation questions, please reach out to Jen Timmer. We also frequently work with partners to design sub-projects to answer specific questions which can easily be compared to baseline IMBCR data.